jumpincactus
Premium Member
Supporter
- 11,609
- 438
I found this study on a site that was contracted thru the US DOE. This shit is way over my head. They used 5 different strains of cannabis in organic soils. I am hoping someone can make heads or tails out of this paper and let me know if its of any value.
I talked with Seamaiden and initially she thought this forum was a good place to start. If it needs to be moved let me know and I will. Here is the link in case all of the active links and such dont post up correctly. Well as I suspected the images and active links are too numerous for the server so if you want full access to all the data please use the link I posted.
http://www.plosone.org/article/info:doi/10.1371/journal.pone.0099641
Correction:
The seventh author’s name and affiliation are incorrect. The correct name is: Joshua A. Hartsel. The correct affiliation is: Delta-9-Technologies, 2534 State Street Offices Suite 458, San Diego, CA 92101.
Reference
Published: September 2, 2014
Copyright: © 2014 The PLOS ONE Staff. This is an open-access article distributed under the terms of the Creative Commons Attribution License, which permits unrestricted use, distribution, and reproduction in any medium, provided the original author and source are credited.
Abstract
Understanding microbial partnerships with the medicinally and economically important crop Cannabis has the potential to affect agricultural practice by improving plant fitness and production yield. Furthermore, Cannabis presents an interesting model to explore plant-microbiome interactions as it produces numerous secondary metabolic compounds. Here we present the first description of the endorhiza-, rhizosphere-, and bulk soil-associated microbiome of five distinct Cannabis cultivars. Bacterial communities of the endorhiza showed significant cultivar-specificity. When controlling cultivar and soil type the microbial community structure was significantly different between plant cultivars, soil types, and between the endorhiza, rhizosphere and soil. The influence of soil type, plant cultivar and sample type differentiation on the microbial community structure provides support for a previously published two-tier selection model, whereby community composition across sample types is determined mainly by soil type, while community structure within endorhiza samples is determined mainly by host cultivar.


123
Citation: Winston ME, Hampton-Marcell J, Zarraonaindia I, Owens SM, Moreau CS, et al. (2014) Understanding Cultivar-Specificity and Soil Determinants of the Cannabis Microbiome. PLoS ONE 9(6): e99641. doi:10.1371/journal.pone.0099641
Editor: Gabriele Berg, Graz University of Technology (TU Graz), Austria
Received: January 8, 2014; Accepted: May 17, 2014; Published: June 16, 2014
This is an open-access article, free of all copyright, and may be freely reproduced, distributed, transmitted, modified, built upon, or otherwise used by anyone for any lawful purpose. The work is made available under the Creative Commons CC0 public domain dedication.
Funding: This work was supported in part by the U.S. Dept. of Energy under Contract DE-AC02-06CH11357. MEW was supported by a U.S. Department of Education GAANN grant. Funding for SMG was provided U.S. Environmental Protection Agency STAR Graduate Fellowship. Computational resources were funded by a Amazon Web Services education grant. The funders had no role in study design, data collection and analysis, decision to publish, or preparation of the manuscript.
Competing interests: Despite the fact that authors Josh Hartsel and Suzanne Kennedy work for commercial companies Cannavest and MO BIO Laboratories, respectively, this does not alter the authors' adherence to PLOS ONE policies on sharing data and materials.
Introduction
Soil microbes play a major role in plant ecology by providing a variety of benefits such as nitrogen fixation, production of growth stimulants, improved water retention, and suppression of root diseases [1]–[4]. These vital microbial processes occur predominantly within the rhizosphere and rhizoplane, and are heavily influenced by fungal saprotrophs and plant-mutualists such as endomycorrhizal and ectomycorrhizal fungi [5], [6]. Despite the economic and medicinal importance of Cannabis spp., little is known about its soil-based microbial associations [7], [8].
[9]–[11]. Rhizosphere microbiota are highly dynamic [12], and the composition of bacterial communities can fluctuate in response to seasonal and diel temperature changes [13], water content [14], pH [15], CO2 concentration, and O2 levels [16]. Although evidence has been found for significant effects of plant cultivar on rhizosphere communities[17]–[19] and endomycorrhizal fungal communities [20], some work suggests that these effects are minimal compared to edaphic factors (particularly pH) or plant growth stage [21], [22].
[23]—have been reported to support plant growth and suppress plant diseases by providing phytohormones, low molecular weight compounds or enzymes involved in regulating growth and metabolism [24]–[26]. In addition, endorhiza bacteria assist their host plants in tolerating the phytotoxic effects of environmental toxicants [27], [28]. Endorhiza communities tend to be more plant-specific, and are often shaped by the compounds or proteins produced by their host [29]. Both endophytes and epiphytes may also play a role in localized ‘flavor’ or terroir for crop plants, as has been shown recently for wines [30]–[32].
[33]–[35]. Under this model, edaphic factors determine the structure of the local soil microbiota, which become the source for the first bacterial community shift into the nutrient rich environment of the rhizosphere. Following this first shift, migration from the rhizosphere into the plant tissues is based on plant genotype-dependent selection of the endorhiza environment [33]. Along with the prediction that rhizosphere and endorhiza microbiota should be soil-derived, the two-tier selection model predicts several broad changes in phylum-level taxon abundance associated with the shifting microbiota, such as dramatic reduction in Acidobacteria within the endosphere.
Table 1). The bulk soil sample was immediately capped and transported to a 4°C refrigerator. In addition, endorhiza samples were taken from the root ball of each of the six plants. The soil that remained adhered to the roots after removal from the ground was used to produce the rhizosphere soil samples. The rhizosphere soil was removed from the roots by shaking the root into a whirlpak bag. All samples were immediately transferred to storage at 4°C for shipping back to the laboratory for processing (approximately 4 hours). All root samples were rinsed with alcohol and sterile water before the extraction. DNA was isolated from 0.25 g of soil or root per extraction using standard protocol for PowerSoil DNA Isolation Kit (MO BIO, USA), with the modification of heating the extraction at 65°C for 10 minutes prior to the initial vortex step. The soil physicochemical data was generated by Fruit Growers Laboratory (Santa Paula, CA), including total carbon and nitrogen concentrations, pH, salinity, and water content for all samples.
Download:
Table 1. Soil Physicochemical Data.
doi:10.1371/journal.pone.0099641.t001Table S1). All cannabinoid data was processed at Delta-9-Technologies, LLC (Santa Ana, California). Otherwise, sampling procedure matched the first experiment.
Illumina sequencing of the V4 region of the 16S rRNA gene
) [36]. The 291 bp length V4 region amplification was performed using the 515F primer and the 806R Golay–barcoded reverse primers (for a full list of these primers visit). Each 25 µL PCR reaction contained 12 µL of MO BIO PCR Water (Certified DNA-Free), 10 µL of 5 Prime HotMasterMix (1x), 1 µL of Forward Primer (5 µM concentration, 200 pM final), 1 µL Golay Barcode Tagged Reverse Primer (5 µM concentration, 200 pM final), and 1 µL of template DNA. The conditions for PCR are as follows: 94°C for 3 minutes to denature the DNA, with 35 cycles at 94°C for 45 s, 50°C for 60 s, and 72°C for 90 s, with a final extension of 10 min at 72°C to ensure complete amplification. PCR was completed in triplicate and products were pooled. Each pool was then quantified using Invitrogen's PicoGreen and a plate reader. Once quantified, different volumes of each of the products were pooled into a single tube so an equal amount (ng) of DNA was in the pool, and cleaned using the UltraClean PCR Clean-Up Kit (MO BIO). After quantification, the molarity of the pool is determined and diluted down to 2 nM, denatured, and then diluted to a final concentration of 6.1 pM with a 30% PhiX spike for sequencing on the Illumina MiSeq. A 151 bp×12 bp×151 bp MiSeq run was performed using the custom sequencing primers and procedures described in the supplementary methods in Caporaso et al. (2012). All raw sequence data is available publicly[37].
Bioinformatic analysis of the 16S rRNA V4 sequence data
[38]. QIIME defaults were used for quality filtering of raw Illumina data. In the second study, both closed and open reference OTU-picking methods were employed. In the first study, OTUs were picked against the Greengenes [39] database pre-clustered at 97% identity, and sequences that did not hit the reference collection were clusteredde novo (i.e. open reference). Representative sequences were aligned to the Greengenes core set with PyNAST [38]. All sequences that failed to align were discarded. A phylogenetic tree was built from the alignment using FastTree [40], and taxonomy was assigned to each sequence using the RDP classifier [41]retrained on Greengenes. Samples for the first experiment were rarified to an even depth of 3,000 sequences. Four samples were discarded due to insufficient sequence coverage. For the second experiment, samples were rarified to an even depth of 45,000 sequences. One sample was discarded due to insufficient coverage. Alpha, and beta-diversity metrics were produced using QIIME [38]. Relationships between samples were visualized and evaluated using redundancy analysis (RDA) and principal coordinate analyses (PCoA) calculated from pairwise sample distances (weighted and unweighted UniFrac metrics) [42]. Significance tests were run using the compare_categories.py (ANOSIM, ADONIS, ANOVA, and RDA) and compare_distance_matrices.py (Mantel) scripts in QIIME [38]. To evaluate the most important abiotic factors in structuring the communities, a Best Subset of Environmental Variables with Maximum (Rank) Correlation with Community Dissimilarities (BEST) analysis was run in QIIME (see vegan::bioenv) [43].
Results
Fig. 1a) yielded significant clustering of endorhiza (ADONIS: R2 = 0.26, p = 0.001) and bulk soil (ADONIS: R2 = 0.14, p = 0.001) samples from the other categories, but rhizosphere samples were not significantly different (ADONIS: R2 = 0.07, p = 0.07). Weighted UniFrac distances yielded similar results with endorhiza (ADONIS: R2 = 0.59, p = 0.001) and bulk soil (ADONIS: R2 = 0.29, p = 0.004) samples demonstrating significant differences from other sample types, but no significant differences for rhizosphere (ADONIS: R2 = 0.09, p = 0.10) samples. Division of all communities via strain (Fig. 1b) was not significant for weighted (ADONIS: R2 = 0.11, p = 0.25) or unweighted (ADONIS: R2 = 0.11, p = 0.15) analyses, however, division of endorhiza communities via strain was significant for both weighted (ADONIS: R2 = 0.59, p = 0.004) and unweighted (ADONIS: R2 = 0.39, p = 0.003) analyses. The abundance of Methylophilus explained a significant portion of this difference (FDR: p = 0.012), comprising 13% of the microbial community in the endorhiza of Bookoo Kush, 0.13% in Burmese and was absent in Diesel. Despite these significant differences, all endorhiza samples maintained a core community of Pseudomonas, Cellvibrio, Oxalobacteraceae, Xanthomonadaceae, Actinomycetales, andSphingobacteriales. With the exception of the aerobic cellulytic bacteriumCellvibrio, all prevalent members of the core endorhiza community were well known endophytic bacteria [44], [45] primarily within the orders Gammaproteobacteria and Alphaproteobacteria, which supports observations from other plant systems [46], [47].
Download:
Figure 1. PCoA plots of microbial community similarity in first experiment for unweighted analysis (A–B) and weighted analysis (C–D).
Fig. 2a) (ADONIS: R2 = 0.32, p = 0.001), among sample types (Fig. 2b) (ADONIS: R2 = 0.12, p = 0.005), and strains (Fig. 2c) (ADONIS: R2 = 0.10, p = 0.008). Cluster comparisons of each individual sample type against all other sample types (Fig. 2b) yielded significant differences for endorhiza (ADONIS: R2 = 0.10, p = 0.001) and rhizosphere (ADONIS: R2 = 0.05, p = 0.04) samples, but no significant differences for bulk soil (ADONIS: R2 = 0.04, p = 0.12) samples. Using weighted UniFrac, community beta diversity varied significantly by soil type (Fig. 2d) (ADONIS: R2 = 0.21, p = 0.001), sample type (Fig. 2e) (ADONIS: R2 = 0.27, p = 0.001), and strain (Fig. 2f) (ADONIS: R2 = 0.27, p = 0.001). Cluster comparisons of each individual sample type against all other sample types (Fig. 2e) yielded significant differences for endorhiza (ADONIS: R2 = 0.26, p = 0.001) and rhizosphere (ADONIS: R2 = 0.13, p = 0.001) samples, with mixed results for bulk soil samples (ADONIS: R2 = 0.06, p = 0.054; ANOSIM: −0.012, p = 0.459; RDA: F = 2.41, p = 0.045).
Download:
Figure 2. PCoA plots of microbial community similarity in second experiment for unweighted analysis (A–C) and weighted analysis (D–F).
Fig. 3a) (ADONIS: R2 = 0.196, p = 0.001), sample type (Fig. 3b) (ADONIS: R2 = 0.086, p = 0.001), and strain (Fig. 3c) (ADONIS: R2 = 0.178, p = 0.001) were highly significant for all tests using unweighted UniFrac. Cluster comparisons of each individual sample type against all other sample types yielded significant results for endorhiza samples (ADONIS: R2 = 0.069, p = 0.001), and mixed results for rhizosphere (ADONIS: R2 = 0.034, p = 0.004; ANOSIM: R = 0.005, p = 0.365; RDA: F = 2.17, p = 0.001) and bulk soil samples (ADONIS: R2 = 0.031, p = 0.005; ANOSIM: R = −0.032, p = 0.628; RDA: F = 2.00, p = 0.003). Likewise, using weighted UniFrac, the division of all communities via soil type (Fig. 3d) (ADONIS: R2 = 0.323, p = 0.001), sample type (Fig. 3e) (ADONIS: R2 = 0.229, p = 0.001), and strain (Fig. 3f) (ADONIS: R2 = 0.301, p = 0.001) was highly significant for all tests. Cluster comparisons of each individual sample type against all other sample types yielded significant results for endorhiza samples (ADONIS: R2 = 0.215, p = 0.001), and mixed results for rhizosphere (ADONIS: R2 = 0.093, p = 0.002; ANOSIM: R = 0.045, p = 0.129; RDA: F = 6.36, p = 0.002) and bulk soil samples (ADONIS: R2 = 0.057, p = 0.008; ANOSIM: R = −0.041, p = 0.691; RDA: F = 3.76, p = 0.006).
Download:
Figure 3. PCoA plots of microbial community similarity in pooled experiments for unweighted analysis (A–C) and weighted analysis (D–F).
Table 2). While strain showed a larger effect than sample type for weighted OTU differences, there were no significant unweighted OTU differences between strains, further suggesting the importance of strain in structuring OTU abundances - rather than OTU presence/absence.
Download:
Table 2. Number of significant OTUs for soil type, sample type, and strain.
doi:10.1371/journal.pone.0099641.t002[33], our results demonstrate a decrease in abundance of Acidobacteria and an increase of Proteobacteria andActinobacteria relative to the rhizosphere and bulk soil (Fig. 4). Furthermore, the most significant OTU abundance difference between sample types was the decrease in Acidobacteria from the order iii1-15 in endorhiza samples (Bonferroni-corrected ANOVA: p = 1.12e-7). Of the 51 OTUs significantly differentiating between sample types, the 17 OTUs which increased in abundance within the Cannabis endorhiza relative to rhizosphere were predominantly Proteobacteria, including several from the Rhizobiales order. Mean abundance of the 51 OTUs were highly correlated between bulk soil and rhizosphere samples (Pearson's rho: 0.92), versus a lower correlation between rhizosphere and Cannabis endorhiza (Pearson's rho: 0.63), and even lower between bulk soil and Cannabis endorhiza (Pearson's rho: 0.42).

Download:
Figure 4. Ternary plot of distribution of bacterial taxonomic groups among sample types in the second experiment.
Fig. 5)Beta distances between rhizosphere and bulk soil communities were significantly lower than distances between rhizosphere and endorhiza communities for both unweighted and weighted analyses (unweighted: t = −4.59, p<0.001 weighted: t = −11.82, p<0.001). Beta distances between rhizosphere and bulk soil communities were significantly lower than distances between bulk soil and endorhiza communities for both unweighted and weighted analyses (unweighted: t = −5.15, p<0.001; weighted: t = −11.56, p<0.001). Beta distances between rhizosphere and endorhiza communities were not significantly different from distances between bulk soil and endorhiza communities for both unweighted and weighted analyses (unweighted: t = −2.10, p = 0.109; weighted: t = −2.23, p = 0.078).
Download:
Figure 5. Box plots of beta-diversity distances between communities for both weighted and unweighted analyses.
[34], [35], [48]. This two-step selection model was tested by pooling samples byCannabis strain and analyzing the core microbiome within each strain. As bulk soils are the putative source of microbes for the plant, endorhiza communities would be expected to share more OTUs with their own soil than with another. White Widow was grown in two different soils, and roots shared more OTUs with the soil they were grown in than with the different soil in which the different white widow plant was grown. The number of shared OTUs between endorhiza and their own soil (n = 45, mean = 2934) was significantly greater (t = −10.05, p = 1.209e-15) than the number of shared OTUs between endorhiza and the other soil (n = 45, mean = 2162).
Cannabinoid concentration and composition was significantly correlated to structure of endorhiza communities
Table 2) between the two soil types in the second experiment, and the soil types used in the first experiment. For both weighted and unweighted UniFrac distances (all samples pooled in the analysis), all edaphic factors tested were significantly correlated with community beta-diversity (p = 0.001). For the weighted analysis, Nitrogen had the strongest effect in structuring the communities (r-stat: 0.465, p-value = 0.001), followed by salinity (r-stat: 0.437, p-value = 0.001), Carbon (r-stat: 0.330, p-value = 0.001), water content (r-stat: 0.281, p-value = 0.001), and pH (r-stat: 0.221, p-value = 0.001). For the unweighted analysis, the relative importance of the edaphic factors remained the same, with Nitrogen as the most important (r-stat: 0.630, p-value = 0.001), followed by salinity (r-stat: 0.620, p-value = 0.001), Carbon (r-stat: 0.512, p-value = 0.001), water content (r-stat: 0.466, p-value = 0.001), and pH (r-stat: 0.292, p-value = 0.001). Running a BEST analysis, the variance in community data is optimally explained by three edaphic factors; Nitrogen, Carbon, & Water (rho = 0.632).
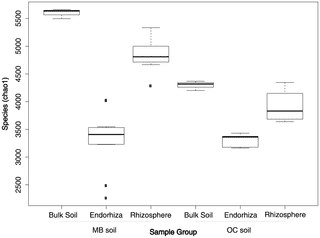
Alpha diversity peaks in bulk soil and declines with the transitions into the rhizosphere and endorhiza microbiomes
Fig. 6) Observed species and chao1 alpha-diversity metrics from the second experiment demonstrated a slight reduction in alpha diversity from bulk soil (chao1: µ = 4947; σ = 717) to rhizosphere samples (chao1: µ = 4525; σ = 542), followed by a dramatic reduction in alpha diversity from rhizosphere to endorhiza (chao1: µ = 3321; σ = 420). Although diversity was significantly higher in MB bulk soil (chao1: µ = 5597; σ = 89) and rhizosphere (chao1: µ = 4859; σ = 286) in comparison to OC bulk soil (chao1: µ = 4296; σ = 85) and rhizosphere (chao1: µ = 3913; σ = 290), diversity of MB endophytes (chao1: µ = 3325; σ = 517) was not significantly different from that of the OC endosphere (chao1: µ = 3311; σ = 112). Despite much shallower sequencing in the first experiment, the same pattern was recovered, with both species richness and chao1 diversity index highest in bulk soil (chao1: µ = 2010.7, σ = 146.2), slightly lower in the rhizosphere (chao1: µ = 1837.2, σ = 114.0), and lowest in the endorhiza (chao1: µ = 916.1, σ = 161.7).
Download:
Figure 6. Box plots of alpha diversity (observed species) for endorhiza, rhizosphere, and bulk soil from two separate soil types in the second eperiment.
[34], [35], [48]. Results from both experiments support many of the expectations produced by this model. Most importantly, the principal coordinate analysis (PCoA) plots for the second experiment demonstrate highly significant clustering patterns. First, soil type is the main determinant of PC1 (32.06%) for the unweighted analysis of the second experiment, revealing that soil is undoubtedly the most important factor in all samples for determining what microbes are present. Second, communities within both soil types demonstrate a similar community shift from bulk soil to endorhiza samples along PC2 (11.34%), which is dominated by differentiation between sample types. Specifically, endorhiza samples have high, positive values along PC2, rhizosphere samples have intermediate values, and bulk soil samples have more negative values. Third, Cannabis strain is the main determinant of PC1 (34.51%) for the weighted analysis of all samples in the second experiment, suggesting that convergent host genotype-dependent selection acts through controlling community structure (abundance) more than composition. PCoA results exhibit how all sample types form significantly differentiated clusters in weighted analyses but that only rhizosphere and endorhiza samples form significantly differentiated clusters in unweighted analyses, suggesting niche-filtering of microbes in rhizosphere and endorhiza samples from bulk soil. Furthermore, there were no significant segregating OTUs based on unweighted analysis between cultivars in endorhiza and rhizosphere samples in the second experiment, however there were 71 when abundance was accounted for. This differs greatly from the 657 OTUs that significantly differ between soil types in the same dataset. Testing of the two-step selection model with pairwise comparisons of shared OTUs between endorhiza and bulk soil samples also validated the hypothesis that a portion of the endophytic microbes are inherited and selected from the surrounding soil, showing significantly more OTU overlap between endorhiza and their own bulk soil compared to endorhiza and foreign bulk soil.
[21], [49], as well as the plant-soil feedbacks identified in structuring belowground microbial communities [50], [51], the differences between the first and second experiments are unsurprising. The similarities, however, are surprising. In particular, that cultivar-specificity could be identified in the microbiota within the endorhiza samples in the first experiment without any input of cultivar-specific metabolites from the living plant for weeks.
[34], [35], [48].
Future work with the Cannabis microbiome should focus on elucidating the role of cultivar on rhizosphere, as well as what aspects of host genotype are producing the structure observed across Cannabis strains. Increased testing of cannabinoids and decoupling this variation from edaphic factors will improve our understanding of the importance of cannabinoid production in structuring endorhiza communities. Sampling a time series of endorhiza communities across several plants may help us to understand natural variation in the endorhiza during the reproductive cycles of Cannabis. Understanding this natural variation will help direct future mechanistic studies aimed at using microbial communities to increase plant fitness, suppress disease, or augment desired metabolite production.
I talked with Seamaiden and initially she thought this forum was a good place to start. If it needs to be moved let me know and I will. Here is the link in case all of the active links and such dont post up correctly. Well as I suspected the images and active links are too numerous for the server so if you want full access to all the data please use the link I posted.
http://www.plosone.org/article/info:doi/10.1371/journal.pone.0099641
Correction:
The seventh author’s name and affiliation are incorrect. The correct name is: Joshua A. Hartsel. The correct affiliation is: Delta-9-Technologies, 2534 State Street Offices Suite 458, San Diego, CA 92101.
Reference
- 1.Winston ME, Hampton-Marcell J, Zarraonaindia I, Owens SM, Moreau CS, et al. (2014) Understanding Cultivar-Specificity and Soil Determinants of the Cannabis Microbiome. PLoS ONE 9(6): e99641 doi:10.1371/journal.pone.0099641.
Published: September 2, 2014
Copyright: © 2014 The PLOS ONE Staff. This is an open-access article distributed under the terms of the Creative Commons Attribution License, which permits unrestricted use, distribution, and reproduction in any medium, provided the original author and source are credited.
Abstract
Understanding microbial partnerships with the medicinally and economically important crop Cannabis has the potential to affect agricultural practice by improving plant fitness and production yield. Furthermore, Cannabis presents an interesting model to explore plant-microbiome interactions as it produces numerous secondary metabolic compounds. Here we present the first description of the endorhiza-, rhizosphere-, and bulk soil-associated microbiome of five distinct Cannabis cultivars. Bacterial communities of the endorhiza showed significant cultivar-specificity. When controlling cultivar and soil type the microbial community structure was significantly different between plant cultivars, soil types, and between the endorhiza, rhizosphere and soil. The influence of soil type, plant cultivar and sample type differentiation on the microbial community structure provides support for a previously published two-tier selection model, whereby community composition across sample types is determined mainly by soil type, while community structure within endorhiza samples is determined mainly by host cultivar.
123
Citation: Winston ME, Hampton-Marcell J, Zarraonaindia I, Owens SM, Moreau CS, et al. (2014) Understanding Cultivar-Specificity and Soil Determinants of the Cannabis Microbiome. PLoS ONE 9(6): e99641. doi:10.1371/journal.pone.0099641
Editor: Gabriele Berg, Graz University of Technology (TU Graz), Austria
Received: January 8, 2014; Accepted: May 17, 2014; Published: June 16, 2014
This is an open-access article, free of all copyright, and may be freely reproduced, distributed, transmitted, modified, built upon, or otherwise used by anyone for any lawful purpose. The work is made available under the Creative Commons CC0 public domain dedication.
Funding: This work was supported in part by the U.S. Dept. of Energy under Contract DE-AC02-06CH11357. MEW was supported by a U.S. Department of Education GAANN grant. Funding for SMG was provided U.S. Environmental Protection Agency STAR Graduate Fellowship. Computational resources were funded by a Amazon Web Services education grant. The funders had no role in study design, data collection and analysis, decision to publish, or preparation of the manuscript.
Competing interests: Despite the fact that authors Josh Hartsel and Suzanne Kennedy work for commercial companies Cannavest and MO BIO Laboratories, respectively, this does not alter the authors' adherence to PLOS ONE policies on sharing data and materials.
Introduction
Soil microbes play a major role in plant ecology by providing a variety of benefits such as nitrogen fixation, production of growth stimulants, improved water retention, and suppression of root diseases [1]–[4]. These vital microbial processes occur predominantly within the rhizosphere and rhizoplane, and are heavily influenced by fungal saprotrophs and plant-mutualists such as endomycorrhizal and ectomycorrhizal fungi [5], [6]. Despite the economic and medicinal importance of Cannabis spp., little is known about its soil-based microbial associations [7], [8].
[9]–[11]. Rhizosphere microbiota are highly dynamic [12], and the composition of bacterial communities can fluctuate in response to seasonal and diel temperature changes [13], water content [14], pH [15], CO2 concentration, and O2 levels [16]. Although evidence has been found for significant effects of plant cultivar on rhizosphere communities[17]–[19] and endomycorrhizal fungal communities [20], some work suggests that these effects are minimal compared to edaphic factors (particularly pH) or plant growth stage [21], [22].
[23]—have been reported to support plant growth and suppress plant diseases by providing phytohormones, low molecular weight compounds or enzymes involved in regulating growth and metabolism [24]–[26]. In addition, endorhiza bacteria assist their host plants in tolerating the phytotoxic effects of environmental toxicants [27], [28]. Endorhiza communities tend to be more plant-specific, and are often shaped by the compounds or proteins produced by their host [29]. Both endophytes and epiphytes may also play a role in localized ‘flavor’ or terroir for crop plants, as has been shown recently for wines [30]–[32].
[33]–[35]. Under this model, edaphic factors determine the structure of the local soil microbiota, which become the source for the first bacterial community shift into the nutrient rich environment of the rhizosphere. Following this first shift, migration from the rhizosphere into the plant tissues is based on plant genotype-dependent selection of the endorhiza environment [33]. Along with the prediction that rhizosphere and endorhiza microbiota should be soil-derived, the two-tier selection model predicts several broad changes in phylum-level taxon abundance associated with the shifting microbiota, such as dramatic reduction in Acidobacteria within the endosphere.
Table 1). The bulk soil sample was immediately capped and transported to a 4°C refrigerator. In addition, endorhiza samples were taken from the root ball of each of the six plants. The soil that remained adhered to the roots after removal from the ground was used to produce the rhizosphere soil samples. The rhizosphere soil was removed from the roots by shaking the root into a whirlpak bag. All samples were immediately transferred to storage at 4°C for shipping back to the laboratory for processing (approximately 4 hours). All root samples were rinsed with alcohol and sterile water before the extraction. DNA was isolated from 0.25 g of soil or root per extraction using standard protocol for PowerSoil DNA Isolation Kit (MO BIO, USA), with the modification of heating the extraction at 65°C for 10 minutes prior to the initial vortex step. The soil physicochemical data was generated by Fruit Growers Laboratory (Santa Paula, CA), including total carbon and nitrogen concentrations, pH, salinity, and water content for all samples.
Download:
Table 1. Soil Physicochemical Data.
doi:10.1371/journal.pone.0099641.t001Table S1). All cannabinoid data was processed at Delta-9-Technologies, LLC (Santa Ana, California). Otherwise, sampling procedure matched the first experiment.
Illumina sequencing of the V4 region of the 16S rRNA gene
) [36]. The 291 bp length V4 region amplification was performed using the 515F primer and the 806R Golay–barcoded reverse primers (for a full list of these primers visit). Each 25 µL PCR reaction contained 12 µL of MO BIO PCR Water (Certified DNA-Free), 10 µL of 5 Prime HotMasterMix (1x), 1 µL of Forward Primer (5 µM concentration, 200 pM final), 1 µL Golay Barcode Tagged Reverse Primer (5 µM concentration, 200 pM final), and 1 µL of template DNA. The conditions for PCR are as follows: 94°C for 3 minutes to denature the DNA, with 35 cycles at 94°C for 45 s, 50°C for 60 s, and 72°C for 90 s, with a final extension of 10 min at 72°C to ensure complete amplification. PCR was completed in triplicate and products were pooled. Each pool was then quantified using Invitrogen's PicoGreen and a plate reader. Once quantified, different volumes of each of the products were pooled into a single tube so an equal amount (ng) of DNA was in the pool, and cleaned using the UltraClean PCR Clean-Up Kit (MO BIO). After quantification, the molarity of the pool is determined and diluted down to 2 nM, denatured, and then diluted to a final concentration of 6.1 pM with a 30% PhiX spike for sequencing on the Illumina MiSeq. A 151 bp×12 bp×151 bp MiSeq run was performed using the custom sequencing primers and procedures described in the supplementary methods in Caporaso et al. (2012). All raw sequence data is available publicly[37].
Bioinformatic analysis of the 16S rRNA V4 sequence data
[38]. QIIME defaults were used for quality filtering of raw Illumina data. In the second study, both closed and open reference OTU-picking methods were employed. In the first study, OTUs were picked against the Greengenes [39] database pre-clustered at 97% identity, and sequences that did not hit the reference collection were clusteredde novo (i.e. open reference). Representative sequences were aligned to the Greengenes core set with PyNAST [38]. All sequences that failed to align were discarded. A phylogenetic tree was built from the alignment using FastTree [40], and taxonomy was assigned to each sequence using the RDP classifier [41]retrained on Greengenes. Samples for the first experiment were rarified to an even depth of 3,000 sequences. Four samples were discarded due to insufficient sequence coverage. For the second experiment, samples were rarified to an even depth of 45,000 sequences. One sample was discarded due to insufficient coverage. Alpha, and beta-diversity metrics were produced using QIIME [38]. Relationships between samples were visualized and evaluated using redundancy analysis (RDA) and principal coordinate analyses (PCoA) calculated from pairwise sample distances (weighted and unweighted UniFrac metrics) [42]. Significance tests were run using the compare_categories.py (ANOSIM, ADONIS, ANOVA, and RDA) and compare_distance_matrices.py (Mantel) scripts in QIIME [38]. To evaluate the most important abiotic factors in structuring the communities, a Best Subset of Environmental Variables with Maximum (Rank) Correlation with Community Dissimilarities (BEST) analysis was run in QIIME (see vegan::bioenv) [43].
Results
Fig. 1a) yielded significant clustering of endorhiza (ADONIS: R2 = 0.26, p = 0.001) and bulk soil (ADONIS: R2 = 0.14, p = 0.001) samples from the other categories, but rhizosphere samples were not significantly different (ADONIS: R2 = 0.07, p = 0.07). Weighted UniFrac distances yielded similar results with endorhiza (ADONIS: R2 = 0.59, p = 0.001) and bulk soil (ADONIS: R2 = 0.29, p = 0.004) samples demonstrating significant differences from other sample types, but no significant differences for rhizosphere (ADONIS: R2 = 0.09, p = 0.10) samples. Division of all communities via strain (Fig. 1b) was not significant for weighted (ADONIS: R2 = 0.11, p = 0.25) or unweighted (ADONIS: R2 = 0.11, p = 0.15) analyses, however, division of endorhiza communities via strain was significant for both weighted (ADONIS: R2 = 0.59, p = 0.004) and unweighted (ADONIS: R2 = 0.39, p = 0.003) analyses. The abundance of Methylophilus explained a significant portion of this difference (FDR: p = 0.012), comprising 13% of the microbial community in the endorhiza of Bookoo Kush, 0.13% in Burmese and was absent in Diesel. Despite these significant differences, all endorhiza samples maintained a core community of Pseudomonas, Cellvibrio, Oxalobacteraceae, Xanthomonadaceae, Actinomycetales, andSphingobacteriales. With the exception of the aerobic cellulytic bacteriumCellvibrio, all prevalent members of the core endorhiza community were well known endophytic bacteria [44], [45] primarily within the orders Gammaproteobacteria and Alphaproteobacteria, which supports observations from other plant systems [46], [47].
Download:
Figure 1. PCoA plots of microbial community similarity in first experiment for unweighted analysis (A–B) and weighted analysis (C–D).
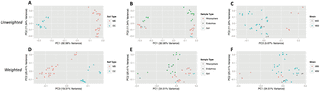
Fig. 2a) (ADONIS: R2 = 0.32, p = 0.001), among sample types (Fig. 2b) (ADONIS: R2 = 0.12, p = 0.005), and strains (Fig. 2c) (ADONIS: R2 = 0.10, p = 0.008). Cluster comparisons of each individual sample type against all other sample types (Fig. 2b) yielded significant differences for endorhiza (ADONIS: R2 = 0.10, p = 0.001) and rhizosphere (ADONIS: R2 = 0.05, p = 0.04) samples, but no significant differences for bulk soil (ADONIS: R2 = 0.04, p = 0.12) samples. Using weighted UniFrac, community beta diversity varied significantly by soil type (Fig. 2d) (ADONIS: R2 = 0.21, p = 0.001), sample type (Fig. 2e) (ADONIS: R2 = 0.27, p = 0.001), and strain (Fig. 2f) (ADONIS: R2 = 0.27, p = 0.001). Cluster comparisons of each individual sample type against all other sample types (Fig. 2e) yielded significant differences for endorhiza (ADONIS: R2 = 0.26, p = 0.001) and rhizosphere (ADONIS: R2 = 0.13, p = 0.001) samples, with mixed results for bulk soil samples (ADONIS: R2 = 0.06, p = 0.054; ANOSIM: −0.012, p = 0.459; RDA: F = 2.41, p = 0.045).
Download:
Figure 2. PCoA plots of microbial community similarity in second experiment for unweighted analysis (A–C) and weighted analysis (D–F).
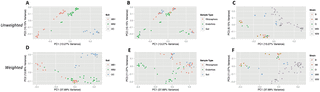
Fig. 3a) (ADONIS: R2 = 0.196, p = 0.001), sample type (Fig. 3b) (ADONIS: R2 = 0.086, p = 0.001), and strain (Fig. 3c) (ADONIS: R2 = 0.178, p = 0.001) were highly significant for all tests using unweighted UniFrac. Cluster comparisons of each individual sample type against all other sample types yielded significant results for endorhiza samples (ADONIS: R2 = 0.069, p = 0.001), and mixed results for rhizosphere (ADONIS: R2 = 0.034, p = 0.004; ANOSIM: R = 0.005, p = 0.365; RDA: F = 2.17, p = 0.001) and bulk soil samples (ADONIS: R2 = 0.031, p = 0.005; ANOSIM: R = −0.032, p = 0.628; RDA: F = 2.00, p = 0.003). Likewise, using weighted UniFrac, the division of all communities via soil type (Fig. 3d) (ADONIS: R2 = 0.323, p = 0.001), sample type (Fig. 3e) (ADONIS: R2 = 0.229, p = 0.001), and strain (Fig. 3f) (ADONIS: R2 = 0.301, p = 0.001) was highly significant for all tests. Cluster comparisons of each individual sample type against all other sample types yielded significant results for endorhiza samples (ADONIS: R2 = 0.215, p = 0.001), and mixed results for rhizosphere (ADONIS: R2 = 0.093, p = 0.002; ANOSIM: R = 0.045, p = 0.129; RDA: F = 6.36, p = 0.002) and bulk soil samples (ADONIS: R2 = 0.057, p = 0.008; ANOSIM: R = −0.041, p = 0.691; RDA: F = 3.76, p = 0.006).
Download:
Figure 3. PCoA plots of microbial community similarity in pooled experiments for unweighted analysis (A–C) and weighted analysis (D–F).
Table 2). While strain showed a larger effect than sample type for weighted OTU differences, there were no significant unweighted OTU differences between strains, further suggesting the importance of strain in structuring OTU abundances - rather than OTU presence/absence.
Download:
Table 2. Number of significant OTUs for soil type, sample type, and strain.
doi:10.1371/journal.pone.0099641.t002[33], our results demonstrate a decrease in abundance of Acidobacteria and an increase of Proteobacteria andActinobacteria relative to the rhizosphere and bulk soil (Fig. 4). Furthermore, the most significant OTU abundance difference between sample types was the decrease in Acidobacteria from the order iii1-15 in endorhiza samples (Bonferroni-corrected ANOVA: p = 1.12e-7). Of the 51 OTUs significantly differentiating between sample types, the 17 OTUs which increased in abundance within the Cannabis endorhiza relative to rhizosphere were predominantly Proteobacteria, including several from the Rhizobiales order. Mean abundance of the 51 OTUs were highly correlated between bulk soil and rhizosphere samples (Pearson's rho: 0.92), versus a lower correlation between rhizosphere and Cannabis endorhiza (Pearson's rho: 0.63), and even lower between bulk soil and Cannabis endorhiza (Pearson's rho: 0.42).
Download:
Figure 4. Ternary plot of distribution of bacterial taxonomic groups among sample types in the second experiment.
Fig. 5)Beta distances between rhizosphere and bulk soil communities were significantly lower than distances between rhizosphere and endorhiza communities for both unweighted and weighted analyses (unweighted: t = −4.59, p<0.001 weighted: t = −11.82, p<0.001). Beta distances between rhizosphere and bulk soil communities were significantly lower than distances between bulk soil and endorhiza communities for both unweighted and weighted analyses (unweighted: t = −5.15, p<0.001; weighted: t = −11.56, p<0.001). Beta distances between rhizosphere and endorhiza communities were not significantly different from distances between bulk soil and endorhiza communities for both unweighted and weighted analyses (unweighted: t = −2.10, p = 0.109; weighted: t = −2.23, p = 0.078).
Download:
Figure 5. Box plots of beta-diversity distances between communities for both weighted and unweighted analyses.
[34], [35], [48]. This two-step selection model was tested by pooling samples byCannabis strain and analyzing the core microbiome within each strain. As bulk soils are the putative source of microbes for the plant, endorhiza communities would be expected to share more OTUs with their own soil than with another. White Widow was grown in two different soils, and roots shared more OTUs with the soil they were grown in than with the different soil in which the different white widow plant was grown. The number of shared OTUs between endorhiza and their own soil (n = 45, mean = 2934) was significantly greater (t = −10.05, p = 1.209e-15) than the number of shared OTUs between endorhiza and the other soil (n = 45, mean = 2162).
Cannabinoid concentration and composition was significantly correlated to structure of endorhiza communities
Table 2) between the two soil types in the second experiment, and the soil types used in the first experiment. For both weighted and unweighted UniFrac distances (all samples pooled in the analysis), all edaphic factors tested were significantly correlated with community beta-diversity (p = 0.001). For the weighted analysis, Nitrogen had the strongest effect in structuring the communities (r-stat: 0.465, p-value = 0.001), followed by salinity (r-stat: 0.437, p-value = 0.001), Carbon (r-stat: 0.330, p-value = 0.001), water content (r-stat: 0.281, p-value = 0.001), and pH (r-stat: 0.221, p-value = 0.001). For the unweighted analysis, the relative importance of the edaphic factors remained the same, with Nitrogen as the most important (r-stat: 0.630, p-value = 0.001), followed by salinity (r-stat: 0.620, p-value = 0.001), Carbon (r-stat: 0.512, p-value = 0.001), water content (r-stat: 0.466, p-value = 0.001), and pH (r-stat: 0.292, p-value = 0.001). Running a BEST analysis, the variance in community data is optimally explained by three edaphic factors; Nitrogen, Carbon, & Water (rho = 0.632).
Alpha diversity peaks in bulk soil and declines with the transitions into the rhizosphere and endorhiza microbiomes
Fig. 6) Observed species and chao1 alpha-diversity metrics from the second experiment demonstrated a slight reduction in alpha diversity from bulk soil (chao1: µ = 4947; σ = 717) to rhizosphere samples (chao1: µ = 4525; σ = 542), followed by a dramatic reduction in alpha diversity from rhizosphere to endorhiza (chao1: µ = 3321; σ = 420). Although diversity was significantly higher in MB bulk soil (chao1: µ = 5597; σ = 89) and rhizosphere (chao1: µ = 4859; σ = 286) in comparison to OC bulk soil (chao1: µ = 4296; σ = 85) and rhizosphere (chao1: µ = 3913; σ = 290), diversity of MB endophytes (chao1: µ = 3325; σ = 517) was not significantly different from that of the OC endosphere (chao1: µ = 3311; σ = 112). Despite much shallower sequencing in the first experiment, the same pattern was recovered, with both species richness and chao1 diversity index highest in bulk soil (chao1: µ = 2010.7, σ = 146.2), slightly lower in the rhizosphere (chao1: µ = 1837.2, σ = 114.0), and lowest in the endorhiza (chao1: µ = 916.1, σ = 161.7).
Download:
Figure 6. Box plots of alpha diversity (observed species) for endorhiza, rhizosphere, and bulk soil from two separate soil types in the second eperiment.
[34], [35], [48]. Results from both experiments support many of the expectations produced by this model. Most importantly, the principal coordinate analysis (PCoA) plots for the second experiment demonstrate highly significant clustering patterns. First, soil type is the main determinant of PC1 (32.06%) for the unweighted analysis of the second experiment, revealing that soil is undoubtedly the most important factor in all samples for determining what microbes are present. Second, communities within both soil types demonstrate a similar community shift from bulk soil to endorhiza samples along PC2 (11.34%), which is dominated by differentiation between sample types. Specifically, endorhiza samples have high, positive values along PC2, rhizosphere samples have intermediate values, and bulk soil samples have more negative values. Third, Cannabis strain is the main determinant of PC1 (34.51%) for the weighted analysis of all samples in the second experiment, suggesting that convergent host genotype-dependent selection acts through controlling community structure (abundance) more than composition. PCoA results exhibit how all sample types form significantly differentiated clusters in weighted analyses but that only rhizosphere and endorhiza samples form significantly differentiated clusters in unweighted analyses, suggesting niche-filtering of microbes in rhizosphere and endorhiza samples from bulk soil. Furthermore, there were no significant segregating OTUs based on unweighted analysis between cultivars in endorhiza and rhizosphere samples in the second experiment, however there were 71 when abundance was accounted for. This differs greatly from the 657 OTUs that significantly differ between soil types in the same dataset. Testing of the two-step selection model with pairwise comparisons of shared OTUs between endorhiza and bulk soil samples also validated the hypothesis that a portion of the endophytic microbes are inherited and selected from the surrounding soil, showing significantly more OTU overlap between endorhiza and their own bulk soil compared to endorhiza and foreign bulk soil.
[21], [49], as well as the plant-soil feedbacks identified in structuring belowground microbial communities [50], [51], the differences between the first and second experiments are unsurprising. The similarities, however, are surprising. In particular, that cultivar-specificity could be identified in the microbiota within the endorhiza samples in the first experiment without any input of cultivar-specific metabolites from the living plant for weeks.
[34], [35], [48].
Future work with the Cannabis microbiome should focus on elucidating the role of cultivar on rhizosphere, as well as what aspects of host genotype are producing the structure observed across Cannabis strains. Increased testing of cannabinoids and decoupling this variation from edaphic factors will improve our understanding of the importance of cannabinoid production in structuring endorhiza communities. Sampling a time series of endorhiza communities across several plants may help us to understand natural variation in the endorhiza during the reproductive cycles of Cannabis. Understanding this natural variation will help direct future mechanistic studies aimed at using microbial communities to increase plant fitness, suppress disease, or augment desired metabolite production.