Anthem
- Posts
- 4,155
- Reactions
- 6,998
- Joined
- Dec 6, 2019
- Points
- 263
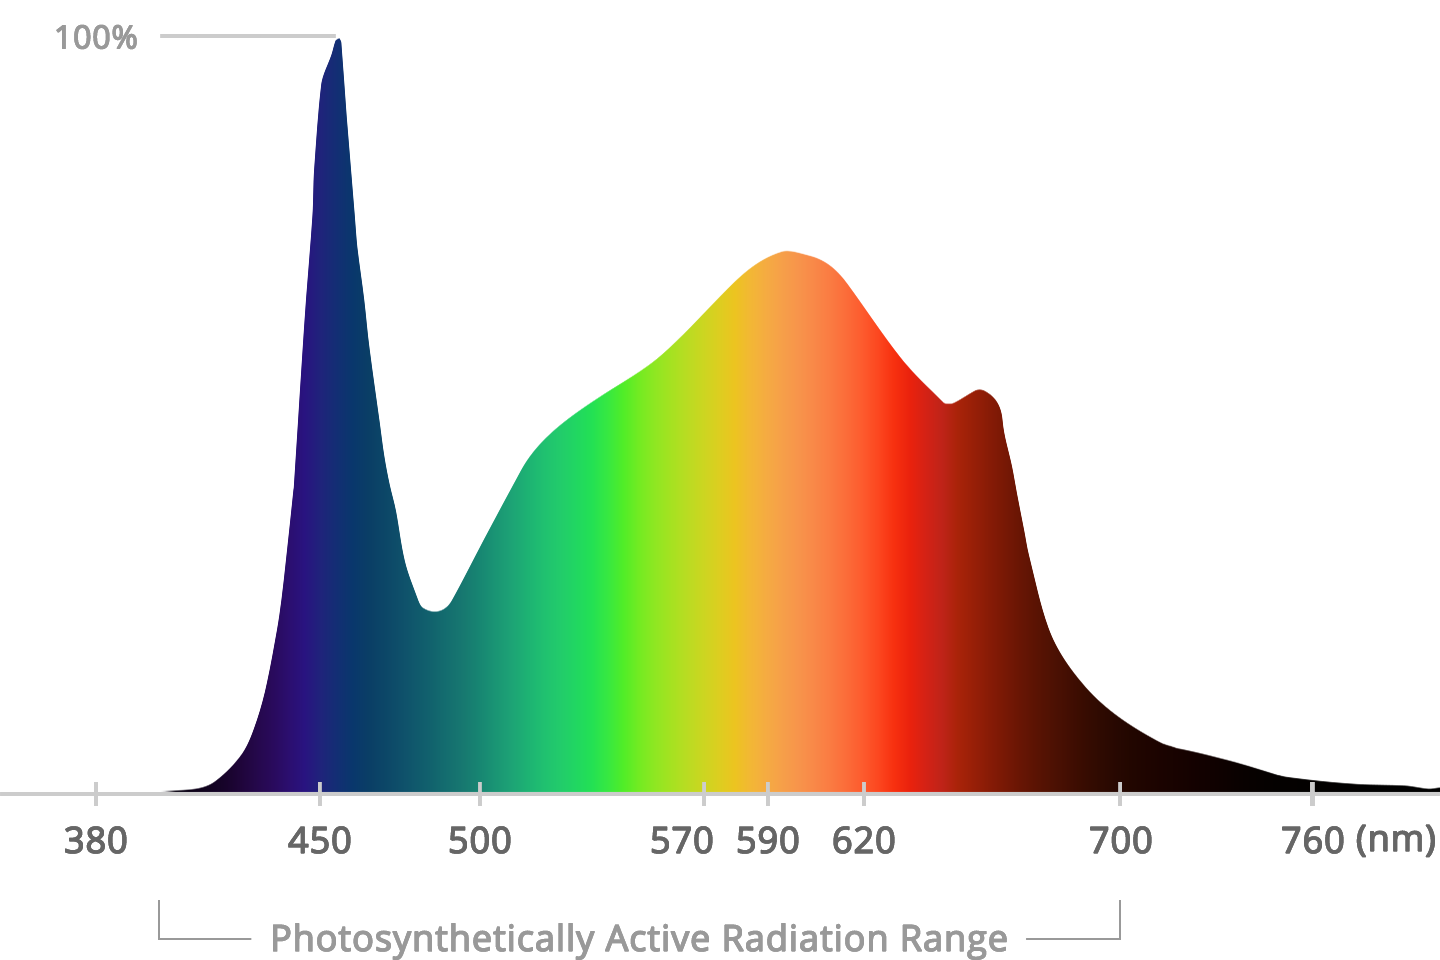
Take a look at the Viparspectra website. The graph is incomplete, there is always an x/y chart showing things. The listed chart only has information along the bottom and a 100 percent at the top of the blue spectrum which means nothing. You have to really look hard at the data and you will find holes.There's just as much if not more blue in the sf and ts lights.